Data discoveries can be exported or sent to the job spooler, regardless of whether or not it's been saved. Any dynamic interactions applied at the time of export (like drill down, dice, sorting, filtering, slicer interactions, etc) will be reflected in the exported discovery.
Click the print icon to open the Print & Export dialog.

General
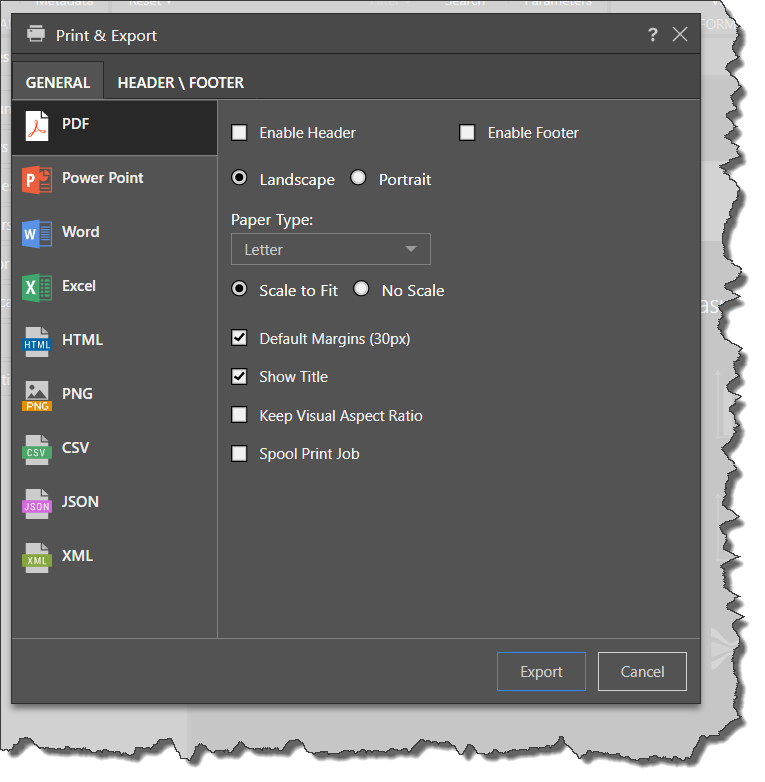
PDF, PowerPoint, Word, and HTML
- Enable Header: enable or disable headers.
- Enable Footer: enable or disable footers.
- Landscape: make the output orientation landscape.
- Portrait: make the output orientation portrait.
- Paper Type: select the paper type/ size from the drop-down.
- Image Quality: set the image quality to low, medium, or high (PowerPoint and Word only).
- Scale to Fit: scale images to fit the output.
- No Scale: don't scale images.
- Default Margins: enable to set margins to default size (30 pixels). Disable to customize the margin size.
- Show Title: enable to show the title of the data discovery in the output.
- Keep Visual Aspect Ratio: enable to keep the visual aspect ration in the output.
- Spool Print Job: send to the job spooler.
Excel
- Freeze Worksheet Panes: select this options if you want to split the worksheet into planes by default.
- Spool Print Job: send to the job spooler.
PNG
- Image Quality: set the image quality to low, medium, or high.
- Scale to Fit: scale images to fit the output.
- No Scale: don't scale images.
- Spool Print Job: send to the job spooler.
CSV, JSON, and XML
- Show Unique Names: enable to show unique names (the member path). For example, [products].[Product Category].
- Show Caption as Column Header: use captions as column headers (instead of unique names). For example, 'Product Category' instead of [products].[Product Category].
- Spool Print Job: send to the job spooler.
Note: exporting to, and printing, Json, XML and CSV is not available in the Community edition.
Headers and Footers
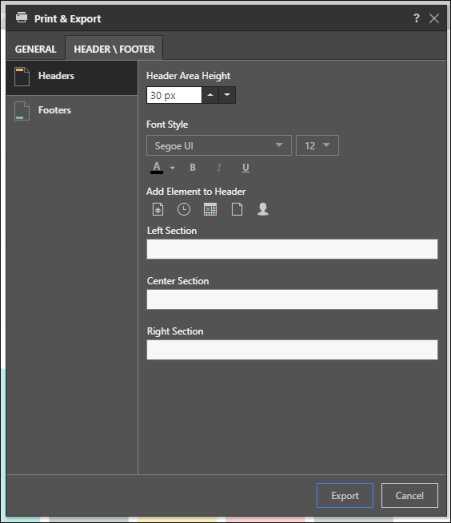
From the Header/ Footer tab, configure any required headers and footers:
- Header/ Footer Area Height: set the area height (in pixels) of the header or footer.
- Font Style: set the font type, size, color, and emphasis.
- Add Element to Header: using the dynamic elements available, add page number, time, date, report name, and user name to the header or footer. By default, each dynamic element will be added to the 'Left Section' of the header or footer (see below for details). To add an element to the center or right section, click the field of the relevant section before selecting the required element.
- Left Section: add the dynamic element or free text to the left section of the header or footer.
- Center Section: add the dynamic element or free text to the center section of the header or footer.
- Right Section: add the dynamic element or free text to the right section of the header or footer.
Note: headers and footers that have been configured will only appear in the output if they are enabled from the General tab.
Export to Excel
When exporting to Excel, each visualization is exported as a matrix grid to a separate Excel sheet (unless the exported visual is a tabular or raw results grid, in which case it will be exported as a flat grid). The sheet tab is named according to the report title, which is also added at the top of the Excel sheet.
For performance reasons, an evaluation based on the machine's memory takes place when exporting to Excel, limiting the amount of cells that can be exported:
- On a 32G machine and above, the limit is 9M cells.
- On a 24G machine, the limit is 7M cells.
- On a 16GB machine, the limit is 5M cells.
- On an 8GB machine or less, the limit is 3M cells
If the limit is reached, all cells will be exported to CSV, rather than Excel. Note that CSV is a flat/ raw grid format.